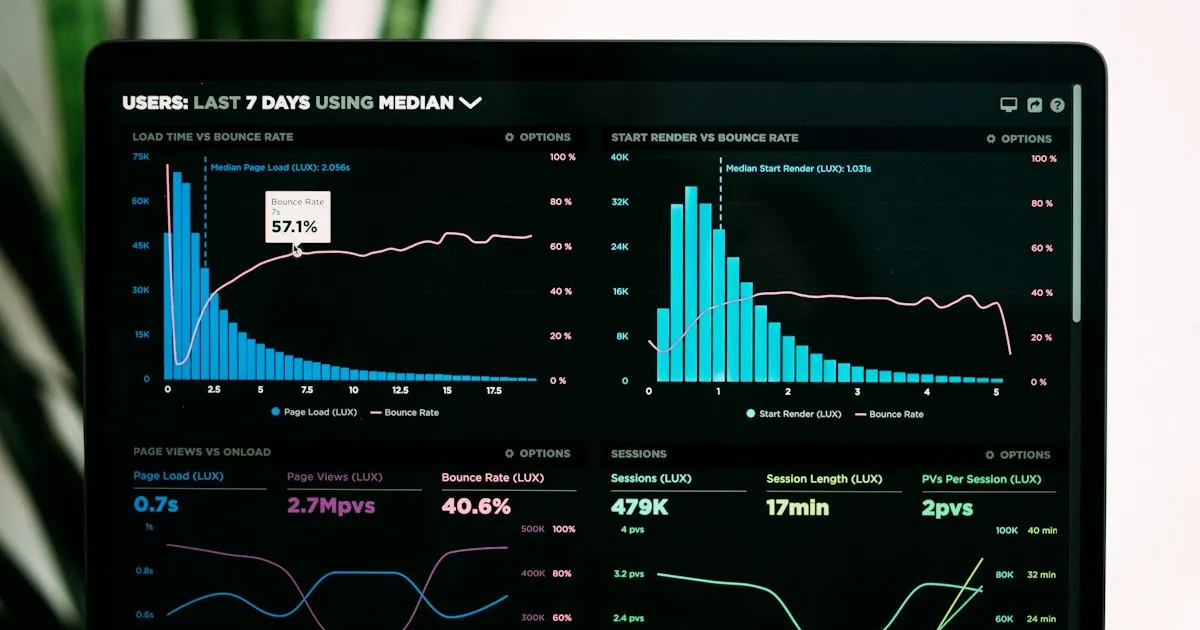
Dashboards tell you that something is broken; distributed tracing tells you exactly why and where. Transitioning our observability stack to OpenTelemetry cut mean time to resolution (MTTR) by over 75%.
The Aggregation Blindspot
Averages lie. Even 99th percentile latency graphs hide the fact that a single downstream third-party payment gateway or database connection lock is impacting specific enterprise customers.
High-cardinality metadata (such as customer_id, tenant_tier, and request_uuid) cannot be indexed in traditional time-series databases without exploding costs. By capturing contextual exemplars inside OpenTelemetry spans, we link anomalous metric spikes directly to the exact trace execution graph.
Semantic Span Conventions
Enforcing uniform span attributes across all Golang, Node, and Python services ensures that engineers can filter traces globally with predictable query syntax: